
Using Google Finance
We just discussed how you can display basic stock info by searching for that stock from the standard Google search box. The resulting information is rather basic, but there's more info available. All you have to do is use the Google Finance site.
Google Finance is a somewhat full-featured financial information site. You can access Google Finance by going directly to finance.google.com, or by clicking the Google Finance link on the stock search results page.
Tip
You can also get to the Google Finance page by clicking the stock symbol link or the intra-day chart.
Like other financial information sites, Google Finance offers a combination of general market news plus in-depth financial information on specific stocks, mutual funds, and public and private companies. The information offered by Google Finance comes from a variety of financial data providers, as well as content obtained by the GoogleBot crawler and stored in Google's main search database.
Tip
Stock quotes from Google Finance can also be delivered to your cell phone or PDA via SMS text messaging. Learn more in Chapter 30, "Using Google Mobile Services."
Accessing General Financial Information
The main Google Finance page, shown in Figure 5.3, offers a variety of general financial news and information. Here's what you'll find:
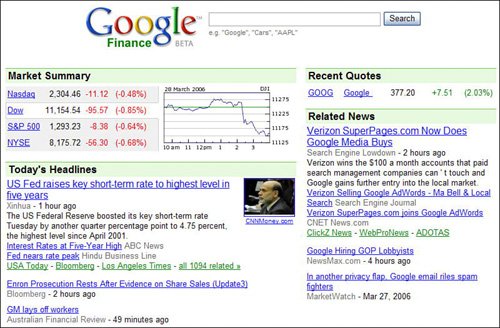
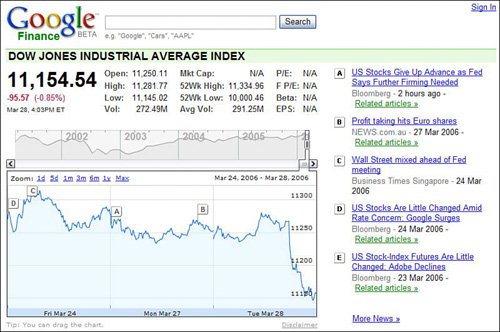
Market Summary. This section displays the latest Nasdaq, Dow, S&P 500, and NYSE levels, as well as an intra-day graph of the Dow Jones Industrial Index. Click any exchange link to view detailed trading data and news. (The dedicated Dow Jones page is shown in Figure 5.4.)
Caution
Google Finance isn't quite as full-featured as some other financial information sites. In particular, Google Finance does not offer information on stock options or bonds. It also offers information only on U.S. companies, although it does offer general news and information from selected international markets (Amsterdam, Brussels, Lisbon, Paris, and Toronto).
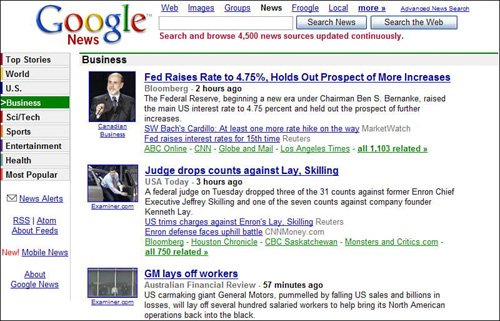
Today's Headlines. The top financial headlines, as reported from a variety of news sites; click any headline to read the entire story. To view additional headlines, scroll down to the bottom of the Today's Headlines section and click the More Headlines link. This displays the Business page from Google News, as shown in Figure 5.5.
Recent Quotes. This is a list of stocks/companies you've recently searched for, accompanied by the current stock price. Related News. This is a list of news headlines for the companies listed in the Recent Quotes section.
Note
Learn more about Google News in Chapter 29, "Using Google News."
Then, of course, there's the ubiquitous Google search box at the top of the page. This isn't a standard Google search box, however; you use this search box to search Google Finance for specific company and stock information. Just enter a stock symbol or company name, and the matching company page will be displayed.
Accessing Specific Stock and Company Information
General financial information is good; more detailed information on specific companies, stocks, or mutual funds is even better. To that end, Google Finance offers dedicated pages for companies and securities, complete with all sorts of useful news and data.
To view a company/security-specific page, you can click the security's name anywhere it's displayed on the Google Finance site or in general Google search results. Alternatively, you can search for that company or security using the search box at the top of the Google Finance main page; instead of a list of search results, Google will display the dedicated company/security page.
As you can see in Figure 5.6, a dedicated company/security page includes a plethora of financial information. Here are the major sections you'll find:
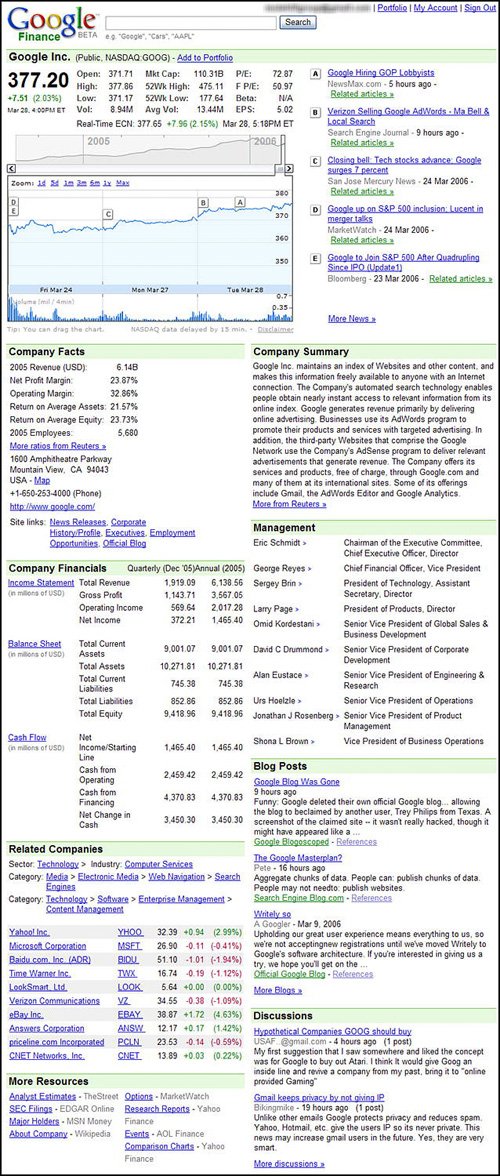
Key metrics. Located in the top-left corner of the page, these include the company/fund name, ticker symbol, current price, dollar/percentage change, open/high/low prices, trading volume and average volume, market cap, 52-week high and low prices, price/earnings (P/E) ratio, forward price/earnings (F P/E) ratio), beta, and earnings per share (EPS). Note
Learn more about Google Blog Search in Chapter 6, "Searching Blogs and Blog Postings."
1-week stock chart. This chart tracks the price of the stock over the past week. Key events are noted on the chart by letters; each letter corresponds to one of the news stories displayed to the right of the chart. (Read more about how to use these interactive charts later in this chapter.) Recent stories. These numbered headlines correspond to the numbered events on the 1-week stock chart. Click any headline to read the complete story. Company summary. A brief description of what the company is and what it does. Management. The names and titles of the company's key officers and senior management. Company facts. More data about the company, including most recent yearly revenue, net profit margin, operating margin, return on average assets, return on average equity, number of employees, company address and phone number, website, and links to additional information. Company financials. Key financial data from the company's most recent annual report, including income statement, balance sheet, and cash flow numbers. Related companies. A list of market sectors and companies that are similar to the company in question. Click any company link to view that company's dedicated Google Finance page. Blog posts. From Google Blog Search, blog postings from around the blogosphere that discuss the company and its stock. Click a posting title to read more, or click the More Blogs link to view more related posts. Discussions. A list of posts discussing the company in the Google Finance Groups. (Learn more about Google Finance Groups later in this chapter.) More resources. Links to additional information about the company, in the form of SEC filings, analyst estimates, research reports, and the like. Click any link to learn more.
|
To the uninitiated, the various financial metrics displayed by Google Finance amount to nothing more than acronym soup. To the savvy investor, however, these metrics are key to evaluating the risk and potential reward for any investment.
So what do these metrics mean? Here's a short primer:
Trading volume: The number of shares traded on the most recent trading day. Important only when compared to the average volume.
Average volume: The total number of shares traded for the previous three months, divided by the number of total trading days in that period. Compare this number to the daily trading volume to see if investor interest in the stock has increased or decreased. For example, if the daily trading volume is higher than the average volume for the past three months, that means that more shares are being traded now than is usual for that stock; the increased investor interest, however, could mean almost anything.
Market capitalization (market cap). The company's market capitalization, calculated by multiplying the current stock price with the number of shares outstanding. For example, if a company's stock is trading at $10 per share and there are 1 million shares outstanding, then the company's market cap is $10 million.
52-week high. The highest price that this security has traded over the past year.
52-week low. The lowest price that this security has traded over the past year.
Revenue. The total sales generated by the company. Typically reported quarterly and yearly.
Operating income. The company's revenue minus all day-to-day operating expenses. It excludes financial-related items, such as interest income, dividend income, and interest expense, as well as taxes.
Operating margin. The company's operating income divided by revenue, expressed as a percentage.
Net income (profit, earnings). The amount of money left over after the company subtracts all its costs and expenses (including interest income, dividend income, and the like) from its revenue.
Net profit margin. The company's total net income divided by revenue, expressed as a percentage.
Earnings per share. The company's profits divided by the number of shares outstandingin other words, the amount of profit earned by each share of stock.
Price/earnings ratio (P/E). The current stock price divided by the company's most recent earnings per share. You use P/E to compare the earnings power of different companies.
Forward price/earnings ratio (F P/E). The current stock price divided by the company's estimated future earnings per share. Some investors think this is a more accurate way to compare the future earnings potential of different companies than standard P/E analysis.
Return on average assets. The ratio of net income divided by average total assets. This is a financial measurement of the efficiency with which a company uses its assets.
Return on average equity (return on equity). The ratio of net income divided by average equity. This is a financial measurement of how effective a business has been in investing its net worth.
Beta. For mutual funds, this is a measure of the fund's volatility relative to the market, typically compared to the performance of the S&P 500. A beta of 1.0 indicates that the fund is more volatile than the market; a beta of less than 1.0 indicates that the fund is less volatile than the market. |
Viewing Interactive Financial Charts
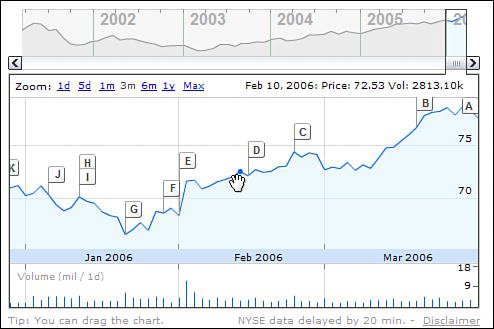
The stock chart displayed on the company/stock Google Finance page, like the one in Figure 5.7, is more informative than it might first appear. That's because this is an interactive chart that you can manipulate to display a variety of different information. You can click the chart to display more or different information.
Note
To fully display Google Finance charts, your computer needs to be running Microsoft Windows 2000, Windows XP, Windows Vista, Mac OS, or Linux. You also need to be using a current version of the Internet Explorer, Firefox, Opera, or Safari web browsers, and have Macromedia Flash Player 7.0 or higher installed. (The charts themselves are displayed using Flash technology.)
First of all, you can change the date range displayed on the chartin several different ways. Quick view zooming is accomplished by clicking the 1d (1-day), 5d (5-day), 1m (1-month), 6m (6-month), 1y (1-year), or Max (life-to-date) links. You can also click and drag the chart to the left or right to display a different range of dates; just hover your cursor anywhere on the chart, hold down the left mouse button, and drag.
In addition, the overview graph just above the main graph displays the stock's price over the life of the stock, with the currently selected range for the main chart displayed as a small slice of the life-to-date chart. To enlarge or shrink the time span displayed in the main chart, click and drag the left positioning handle in this "window" on the subsidiary chart. Alternatively, you can drag the positioning button below this "window" to display a different date range, as shown in Figure 5.8.
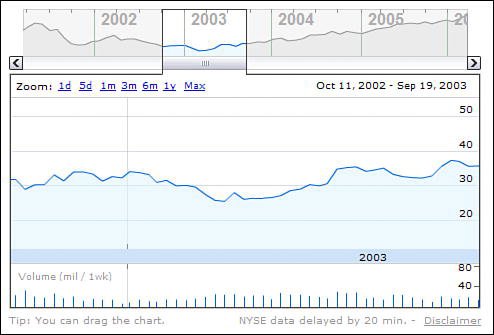
Another fun thing about these interactive charts is the ability to display price information at a specific time. All you have to do is hover your cursor over a specific spot on the trend line, which highlights a specific date and time of day. The price and volume information for that point in time is displayed at the top of the chart.
And, as discussed previously, key news stories about the company are pinpointed on the chart by a series of letter buttons (A, B, C, and so on). Click a letter and the corresponding news story is highlighted in the section to the right of the graph. Click the headline to read the full story.
Tracking Your Portfolio
There's one other section on the Google Finance site that you might find useful. I'm talking about the Portfolio section, shown in Figure 5.9. You access your portfolio by clicking the Portfolio link at the top of the main Google Finance page. (This feature is visible only if you have a Google Account and if you're signed in at the time.)
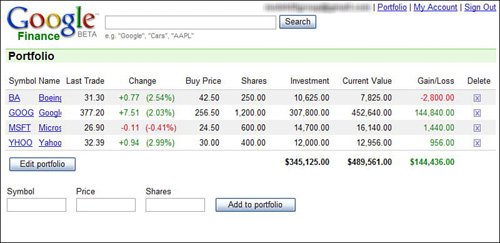
Your Google Finance Portfolio is how you track the performance of a selected group of stocks and mutual funds, right from the main Google Finance page. This list can be those stocks in your actual portfolio, or simply a group of stocks in which you have interest. In any case, it's a good way to put the financial information you're most interested in front and center on the Google Finance page.
Note
To create a Google Account, go to www.google.com/accounts/ and follow the onscreen instructions. A Google Account is completely free, and is necessary to use the Google Finance Portfolio feature, as well as Gmail, Google Alerts, and other personalized Google features.
What information is included on the Google Finance Portfolio page? For each stock, you'll see the following:
Symbol Company or fund name (click either the symbol or name link to view the detailed Google Finance page for that security) Last trade (current price) Change (dollar and percentage change from previous day price) Buy price (the price you paid for these shares, if entered) Shares (the number of shares you own, if entered) Investment (your total investment in this security, if you entered price and share information) Current value (the current value of your investment in this security, based on the current share price, if you entered price and share information) Gain/loss (your current gain or loss on this security, if you entered price and share information)
To create your portfolio, make sure you have a Google Account and that you're signed in before you access the Google Finance page. (Alternatively, you can click the Sign In link at the top of the Google Finance page.) Once you're signed in, you can then create your Google Finance Portfolio. Just follow these steps:
1. | Click the Portfolio link at the top of the Google Finance page.
| | | 2. | When the Portfolio pages appears, as shown in Figure 5.10, enter the stock symbol you want to track.
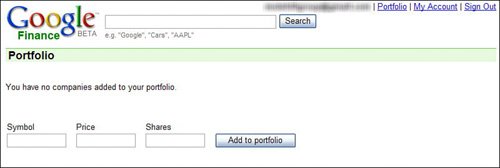
| 3. | If you want to track performance versus cost, you should also enter the price you paid and how many shares you own (both optional).
| 4. | Click the Add to Portfolio button.
| 5. | Repeat steps 2-4 to add additional stocks to your portfolio.
| 6. | When you're done adding stocks, click the Google Finance logo to return to the main Google Finance page.
|
Tip
To track a security with multiple shares purchased at different prices, you'll need to enter each purchase of the security separately.
You can add new stocks to your portfolio at any time by entering the Symbol, Price, and Shares information and clicking the Add to Portfolio button. You can also change your portfolio information by clicking the Edit Portfolio button, and then changing the Buy Price and Shares information for any listed security. To delete any security from your portfolio, click the Delete link next to the security.
 |


