Viewing a ProcessObjective: Explain how to view system processes. Solaris is a multitasking environment in which a number of programs run at the same time. This means that many users can be active on the system at the same time, running many jobs (processes) simultaneously. Each Solaris program can start and stop multiple processes while it is running, but only one job is active per processor at any given time while the other jobs wait in a job queue. Because each process takes its turn running in very short time slices (much less than a second each), multitasking operating systems give the appearance that multiple processes are running at the same time. A parent process forks a child process, which, in turn, can fork other processes. Note Forks The term fork is used to describe a process started from another process. As with a fork in the road, one process turns into two. You'll also see the term spawn usedthe two words are interchangeable for the purposes of this subject. A program can be made up of many processes. A process is part of a program running in its own address space. A process under Solaris consists of an address space and a set of data structures in the kernel to keep track of that process. The address space is divided into various sections that include the instructions that the process may execute, memory allocated during the execution of the process, the stack, and memory-mapped files. The kernel must keep track of the following data for each process on the system:
A process is distinct from a job, command, or program that can be composed of many processes working together to perform a specific task. For example, a computer-aided design application is a single program. When this program starts, it spawns other processes as it runs. When a user logs in to the program, it spawns yet other processes. Each process has a process ID associated with it and is referred to as a PID. You can monitor processes that are currently executing by using one of the commands listed in Table 5.1. Before getting into the commands used to monitor processes, you first need to become familiar with process attributes. A process has certain attributes that directly affect execution. These are listed in Table 5.2.
Use the ps command to view processes currently running on the system. Use the ps command when you're on a character-based terminal and don't have access to a graphical display. Adding the -l option to the ps command displays a variety of other information about the processes currently running, including the state of each process (listed under S). The codes used to show the various process states are listed in Table 5.3. To see all the processes that are running on a system, type the following: ps -el The system responds with the following output: # ps -el F S UID PID PPID C PRI NI ADDR SZ WCHAN TTY TIME CMD 19 T 0 0 0 0 0 SY ? 0 ? 0:18 sched 8 S 0 1 0 0 40 20 ? 150 ? ? 0:00 init 19 S 0 2 0 0 0 SY ? 0 ? ? 0:00 pageout 19 S 0 3 0 0 0 SY ? 0 ? ? 0:01 fsflush 8 S 0 309 1 0 40 20 ? 217 ? ? 0:00 sac 8 S 0 315 1 0 40 20 ? 331 ? ? 0:00 sshd 8 S 0 143 1 0 40 20 ? 273 ? ? 0:00 rpcbind 8 S 0 51 1 0 40 20 ? 268 ? ? 0:00 sysevent 8 S 0 61 1 0 40 20 ? 343 ? ? 0:01 picld 8 S 0 453 403 0 50 20 ? 1106 ? ? 0:00 dtfile 8 S 0 189 1 0 40 20 ? 509 ? ? 0:00 automoun 8 S 0 165 1 0 40 20 ? 292 ? ? 0:00 inetd 8 S 0 200 1 0 40 20 ? 415 ? ? 0:00 syslogd 8 S 0 180 1 0 40 20 ? 266 ? ? 0:00 lockd 8 S 0 219 1 0 40 20 ? 391 ? ? 0:00 lpsched 8 S 1 184 1 0 40 20 ? 306 ? ? 0:00 statd 8 S 0 214 1 0 40 20 ? 365 ? ? 0:00 nscd 8 S 0 204 1 0 40 20 ? 254 ? ? 0:00 cron 8 S 0 232 1 0 40 20 ? 173 ? ? 0:00 powerd 8 S 0 255 254 0 40 20 ? 215 ? ? 0:00 smcboot 8 S 0 258 1 0 40 20 ? 356 ? ? 0:02 vold The manual page for the ps command describes all the fields displayed with the ps command, as well as all the command options. Table 5.4 lists some important fields.
You often want to look at all processes. You can do this using the command ps -el. A number of options available with the ps command control what information gets printed. A few of them are listed in Table 5.5.
For a complete list of options to the ps command, refer to the Solaris online manual pages. Note sort Command The sort command is useful when you're looking at system processes. Use the sort command as the pipe output to sort by size or PID. For example, to sort by the SZ field, use the command ps -el | sort +9 (remember, sort starts numbering fields with 0). pgrepThe pgrep command replaces the combination of the ps, grep, egrep, and awk commands that were used to manage processes in earlier releases of Solaris. The pgrep command examines the active processes on the system and reports the process IDs of the processes whose attributes match the criteria you specify on the command line. The command syntax for the pgrep command is shown here: pgrep <options> <pattern>pgrep options are described in Table 5.6.
For example, the following pgrep command finds all processes that have "dt" in the process argument string: pgrep -l -f "dt" The system responds with this: 500 /usr/dt/bin/dtlogin -daemon 16224 ./dtterm 438 /usr/dt/bin/dtlogin -daemon 448 /usr/openwin/bin/Xsun :0 -defdepth 24 -nobanner -auth /var/dt/A:0-p_aW2a 520 dtgreet -display :0 To find the process ID for the lpsched process, issue this command: pgrep -l lpsched The system responds with this: 6899 lpsched prstatUse the prstat command from the command line to monitor system processes. Again, like the ps command, it provides information on active processes. The difference is that you can specify whether you want information on specific processes, UIDs, CPU IDs, or processor sets. By default, prstat displays information about all processes sorted by CPU usage. Another nice feature with prstat is that the information remains on the screen and is updated periodically. The information displayed by the prstat command is described in Table 5.7.
This section will introduce some new terminology, so Table 5.8 defines a few terms related to processing in general.
The syntax for the prstat command is as follows: prstat [options] <count> <interval> Table 5.9 describes a few of the prstat command options and arguments. Note psrinfo Command psrinfo displays one line for each configured processor, displaying whether it is online, non-interruptible, offline, or powered off, as well as when that status last changed. The following example uses the prstat command to view the four most active root processes running. The -n option is used here to restrict the output to the top four processes. The next number, 5, specifies the sampling interval in seconds, and the last number, 3, runs the command three times: prstat -u root -n 4 5 3 The system displays the following output: PID USERNAME SIZE RSS STATE PRI NICE TIME CPU PROCESS/NLWP 4375 root 4568K 4344K cpu0 59 0 0:00:00 0.4% prstat/1 4298 root 7088K 5144K sleep 59 0 0:00:02 0.2% dtterm/1 304 root 2304K 1904K sleep 59 0 0:02:35 0.0% mibiisa/7 427 root 1832K 1304K sleep 59 0 0:00:00 0.0% rpc.rstatd/1 Total: 53 processes, 111 lwps, load averages: 0.02, 0.01, 0.01 The output updates on your display five times every three seconds. I described projects in Chapter 4, "User and Security Administration," where user accounts can be assigned to project groups. These projects can also be used to label workloads and separate projects and a project's related processes from one another. The project provides a networkwide administrative identifier for related work. A project consists of tasks, which collect a group of processes into a manageable entity that represents a workload component. You can use the prstat command with the -J option to monitor the CPU usage of projects and the -k option to monitor tasks across your system. Therefore, you can have prstat report on the processes related to a project rather than just list all system processes. In addition, the system administrator can set processing limits on the project, such as setting a limit on the total amount of physical memory, in bytes, that is available to processes in the project. For more information on projects and resource capping, read the man pages on the following commands: rcapd(1M), project(4), rcapstat(1), and rcapadm(1M). Process ManagerIn the Desktop Environment (CDE & JAVA Desktop) you have access to the Process Manager GUI, sdtprocess, a graphical tool that provides a process manager window for monitoring and controlling system processes. Exam Alert The exam will most likely ask you about the command-line tools used to manage system processes, such as kill, pkill, pargs, and pgrep. You only need to understand that GUI tools can be used to manage processes and you should be prepared to identify these GUI tools. The advantage of using the Process Manager is that you can view and control processes without knowing all the complex options associated with the ps and kill commands. For example, you can display processes that contain specific character strings, and you can sort the process list alphabetically or numerically. You can initiate a search using the find command, or you can terminate a process simply by highlighting it and clicking kill. To open the Process Manager, you need to log into the Desktop windowing environment. You can start the GUI by executing the command sdtprocess, as follows: sdtprocess & Or, you can click Find Process on the Tools subpanel, as shown in Figure 5.1. Figure 5.1. Front panel.
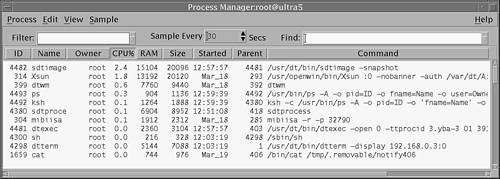
The Process Manager window opens, as shown in Figure 5.2. Figure 5.2. Process Manager window.
Each process attribute in the header of the Process Manager window provides detailed information about the process and is described in Table 5.10.
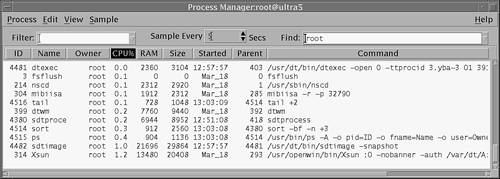
Click any of the column headings to sort the processes by that attribute. For example, click the CPU heading to sort all processes by their CPU usage. The list updates every 30 seconds, but you can enter a value in the Sampling field to update the list as frequently as you like. Finally, you can enter a text string that is common to the process entries of all the processes you want to display in the Find drop-down menu. In Figure 5.3, I entered "root" in the Find field to display all processes owned by root. I also changed the sampling rate to every 5 seconds and clicked the CPU heading to sort processes by their CPU usage. Figure 5.3. Sorted Process Manager window.
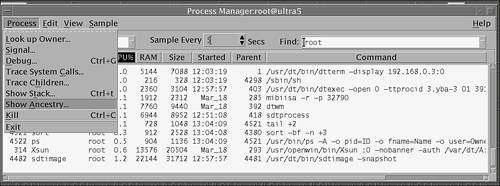
Another nice feature of the Process Manager is the capability to display the ancestry of a process. When a Unix process initiates one or more processes, these are child processes, or children. Child and parent processes have the same user ID. To view a parent process and all the child processes that belong to it, highlight the process in the Process Manager window. Click Process from the toolbar at the top of the window and select Show Ancestry, as shown in Figure 5.4. Figure 5.4. Selecting Show Ancestry.
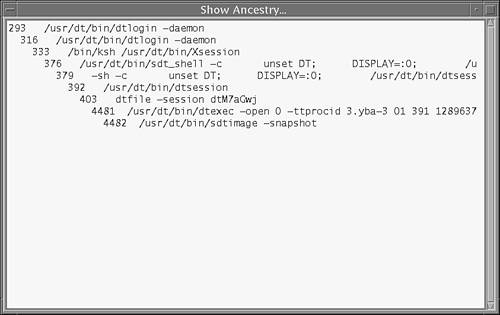
The window shown in Figure 5.5 displays showing all the processes belonging to the parent. Figure 5.5. Show Ancestry window.
The command-line equivalent to the Ancestry selection in the Process Manager is the ptree command. Use this command when you don't have a graphical display terminal. The ptree command displays the process ancestry trees containing the specified PIDs or users. The child processes are displayed indented from their respective parent processes. For example, here is the process tree for the -sh process, which has a PID of 293: ptree 293 The system responds with this: 293 /usr/dt/bin/dtlogin -daemon
316 /usr/dt/bin/dtlogin -daemon
333 /bin/ksh /usr/dt/bin/Xsession
376 /usr/dt/bin/sdt_shell -c unset DT;DISPLAY=:0;/usr/dt/bin/dt
379 -sh -c unset DT; DISPLAY=:0; usr/dt/bin/dtsession_res - \
merge
392 /usr/dt/bin/dtsession
402 /usr/dt/bin/dtterm -session dthIaGth -C -ls
418 -shSMC Process ToolThe Solaris Management Console (SMC) includes a GUI called the Process Tool, which is used for viewing and managing processes, similar to the Desktop Process Manager tool described in the previous section. You can use the job scheduler tool to
To open the Process Tool, follow Step by Step 5.1.
The Process Tool works much the same way as the Process Manager tool described earlier. pargsThe pargs command is used from the command line to examine the arguments and environment variables of a process (or number of processes). pargs can also be used to examine core files. The syntax for the pargs command is as follows: pargs [options] pid | coreTable 5.11 describes the pargs command options and arguments.
For example, use the pargs command to view all of the environment variables associated with the telnetd process, I first need to find the PID of the telnetd process using pgrep as follows: # pgrep telnetd 16173 Next, I issue the pargs command using the PID for the telnetd process as an argument: # pargs -e 16173 16173: /usr/sbin/in.telnetd envp[0]: SMF_RESTARTER=svc:/network/inetd:default envp[1]: SMF_FMRI=svc:/network/telnet:default envp[2]: SMF_METHOD=inetd_start envp[3]: PATH=/usr/sbin:/usr/bin envp[4]: TZ=US/Michigan svcsThe Service Management Facility (SMF) was described in Chapter 3, "Perform System Startup and Shutdown Procedures," so I won't be redundant by describing it again here. However, this is just a reminder that you can use the svcs command with the -p option to list all processes associated with each service instance. |